Investing in the look and feel of your applications doesn’t matter…or does it?
October 7, 2015Updated PDF API
October 16, 2015Introducing Synergy .NET Remote Debugger
We have all experienced the pain of deploying software into the field only to have users break it in new and unexpected ways. Good thing there are debuggers. But what if one of your Synergy .NET programs has a bug that can be reproduced only on a remote server that doesn’t have Visual Studio? You may be able to install Visual Studio on the server, but you may not want to put your source code on a customer‑controlled system. If that’s the case, how do you debug the problem?
Remote Tools to the rescue!
Remote Tools for Visual Studio 2015 enables you to use Visual Studio on your development machine to run, debug, and profile programs on another machine. This means you can run and debug a Synergy .NET program on a remote Windows desktop system or server.
To use remote debugging, your Windows development system must have Visual Studio 2015, and the remote system must have Remote Tools—either the x86 version for a 32-bit machine or the x64 version for a 64-bit machine. Both are available on the Visual Studio downloads site, and both work with Synergy .NET applications. However, if you want to be able to examine Synergy variables (records, groups, descriptor types, etc.) as you debug, you will also need to install the Synergy .NET Remote Debugger on the remote machine. This new Synergy/DE product isn’t something you run or control. It is simply a set of libraries that enable the Visual Studio Remote Debugger to work with Synergy types. Synergy .NET Remote Debugger is available in the Synergy/DE 10.3 area of the Synergy/DE Resource Center Download page: https://resourcecenter.synergex.com/product/download/v10.3/win.aspx.
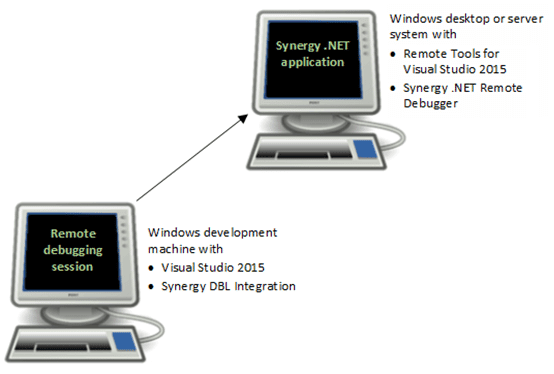
Once you have the correct version of Remote Tools installed on the remote desktop or server system, Remote Debugger (which is installed as part of Remote Tools) will need to be configured. You might imagine that remote debugging requires some network configuration, and you would be right!
Start by running Remote Debugger with Windows administrator privileges. Administrator privileges are required when you start this for the first time because it attempts to use the Windows Web Services API, and it attempts to make changes to your firewall configuration for access to required ports. If there are issues with this process, the Remote Debugging Configuration dialog may open. If this happens, use the following settings, and then click “Configure remote debugging”:
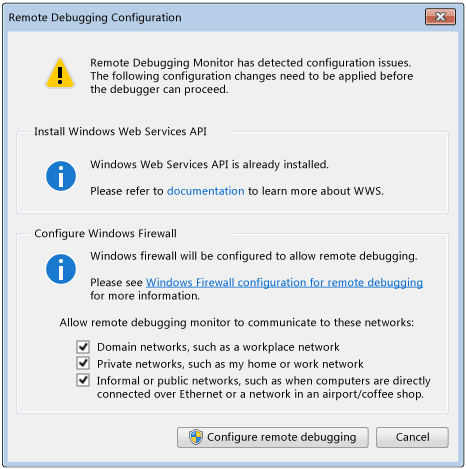
When the configuration process is complete, Remote Debugger starts broadcasting the remote computer name over the local subnet of your network.
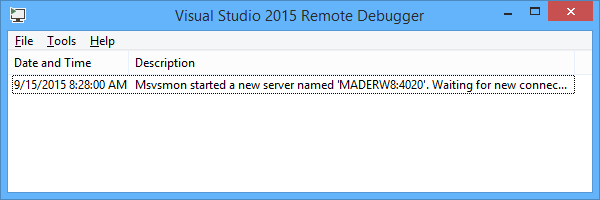
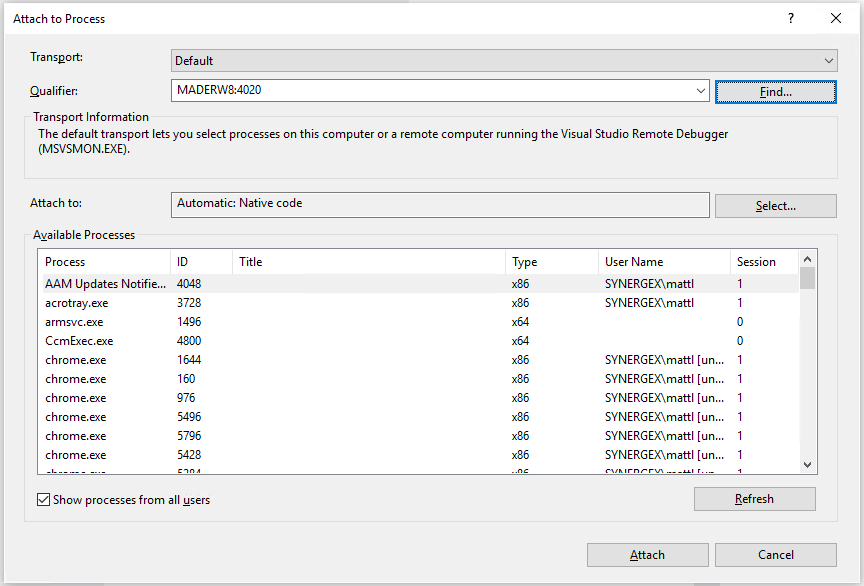
At this point, you should be able to select the remote computer in the Visual Studio “Attach to Process” dialog. To open this dialog, select Debug > “Attach to Process” from the Visual Studio menu on your development machine.
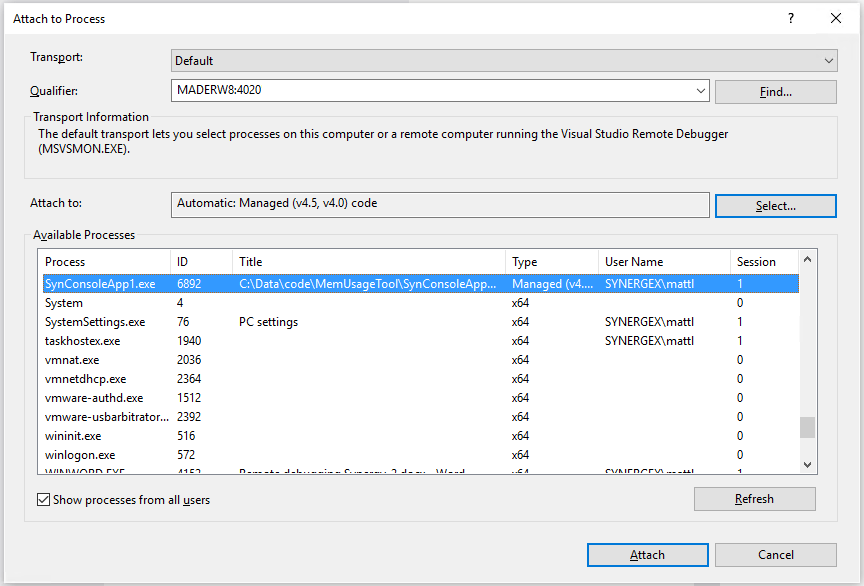
In the Attach to Process dialog, select the name of your remote machine from the Qualifier dropdown. If you don’t see it in the dropdown list, click Find or just enter the remote machine’s name or its IP address and port separated by a colon:
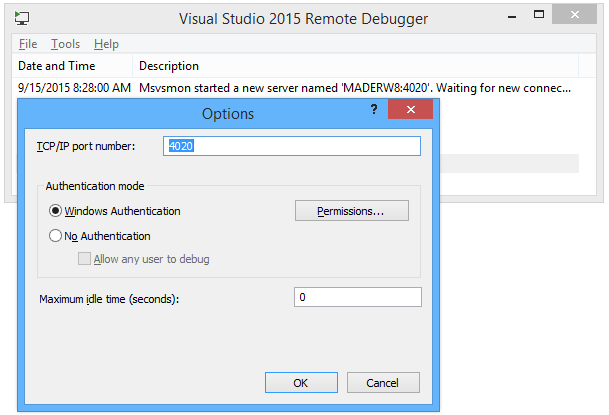
By default, Remote Debugger uses Windows authentication, but you can turn this off. Note, however, that you should not do this in an environment where others could have network access to the remote machine because as long as the Remote Debugger is running, it has ultimate control over the remote machine. (In other words, don’t run Remote Debugger without Windows authentication in an insecure environment. And in a secure environment, don’t run it any longer than necessary without Windows authentication.) You can change the authentication mode (and control which Windows users are allowed to connect) through the Option dialog for the Remote Debugger. Select Tools > Options from the menu to open this dialog. It looks like this:
When a connection is established to the remote machine, select the program you want to debug from the Available Processes list on the Attach to Process dialog. Then click the Attach button.
Once you have selected the process for your Synergy .NET program, you should have the same debug experience that you would for an application running locally on your development system.
Remote debugging can be a real life saver for problems that just won’t reproduce in development. But keep in mind that if you are debugging in a live environment, all threads will be paused while you are stepping through the code. So if several users access the software at the same time, it will look to them like the service is either running very slowly or not at all.
For more information on remote debugging, see the MSDN article “Remote Debugging and Diagnostics”.

